
Indian Economy: Is Semi-Feudal Semi-Colonial still relevant? (part three) – Mudunuri Bharathi & R.Vijay

continued from Part 2…
One of the current opinions on Indian agriculture is the non- viability of production units in agriculture.4 Non-viability implies that the production units are not able to reproduce themselves even at the existing level.5
An explanation that is gaining in importance recently traces the non-viability of units to the policy of encouraging markets in the decision making of the production unit of agriculture, instead of state provision. The shift in emphasis to market interaction brings with it a concomitant set of uncertainties to the production unit. In the absence of a well-organized insurance market, the consequences of uncertainties are to be borne by the production unit.
Further, the shift in regime to the growing importance of market has also brought into focus the reduction in the subsidy to the agricultural sector. In the process, the production agents are facing increasing input prices and a volatile output prices. All these factors adversely effect the performance of agriculture, a production structure dominated by the small farmers. In the absence of public provision of services, the farming community dominated by small scale of operation is not in a position to innovate and is less prone to diversity. A series of suicide deaths by farmers on the one hand and deceleration in growth in agriculture on the other hand is calling the attention of policy makers and academician to look into the agricultural sector freshly. The ‘Report of Commission of Farmers Welfare (2004)’ and ‘Report of National Commission of Farmers (2006)’ points towards this aspect. Vyas, a leading economist who has done extensive work on agriculture, has also commented extensively on this aspect (Vyas (2003)).6
The analysis for the most part relies on the production structure of agriculture and seldom uses the economic structure. There are two important segments of the economic structure that determine the decision making of the production structure. One segment is the agricultural labour families, a set of households who supply labour and are the supply side of the labour market. They together with the demand generated by production structure define the wage rates, a crucial defining variable which determine the level, nature and extent of production. In case the labour market is not self-correcting and inactive leading to structural unemployment, labour supplying households may prefer to enter the production structure by entering the tenancy market and become pure tenants. In the process, these households hedge against uncertainties in the labour market.
This makes the production structure elastic, expanding in case where the labour market is inactive and contracting with the level of activity of the labour market. The recent phase is witnessing an increase in the proportion of land under tenancy. However its implication on the short and long term decisions of the production structure are not analyzed in-depth while studying viability of agriculture.
At the other end of the economic structure are the owners of land who own land but do not themselves cultivate the land. This set of households form the supply side of the lease market. They determine the rent,extent of land leased and the form of lease.
In the classical model of transition from feudalism to capitalism, these segments are referred to as landlords. The policy of Land reform attempted to eliminate the influence of this section on agriculture. However, the recent N.S.S rounds on Assets and Liabilities show the importance of a section of households who own land, stay in the village and do not self-cultivate the land.
This section of households are referred to as non-cultivating ‘peasant’ households (referred to as NCPH from now onwards). The NSS report show that this section is increasing in importance and are influencing the decisions in the production structure. The present section analyses the changing rural structure with an emphasis on the importance of NCPH in the rural sector.
This discussion is organized in three sub-sections. In the first sub-section, information on the changing rural structure and the importance of NCPH is presented. The author was part of a project to analyze the nature of land and poverty in rural sector in nine villages in Andhra Pradesh. The results of this study are used to draw parallels to the inferences derived from the state level data and this constitutes the second sub-section. The last sub-section is the concluding section.
3.1. Changing rural structures
Rural economic structure has been undergoing changes, largely due to public policy and consequent changes in the decision making process of the individual economic agents. During the initial phase, the public policy orientation was directed mainly at restructuring the agrarian structure through series of Land Reform measures followed by reforms in trade and credit. The attempt was to eliminate the influence of agents who are other than cultivators and who were perceived to have adverse effect on the cultivating agents. The second phase in the public policy was to induce changes in the production function with a public provision of the knowledge, inputs needed in production and purchase of output produced. This is commonly known as the phase of green revolution. The third phase of public policy was to encourage the industry and urbanization. The resultant of these policy interventions was a growing agriculture sector and the consequent demand for non-farm services in terms of trading of the inputs and output services. This process can be visualized as a growth-induced generation of non-farm activities. At the other end, the growth of urbanization and industry encouraged the formation of the informal sector in the economy leading to part time-temporary migration of rural labour to urban areas generating demand for non-farm activities. In addition, there are certain non-farm activities like development of diary and poultry that are gaining in importance. These processes are changing the rural economic structure.
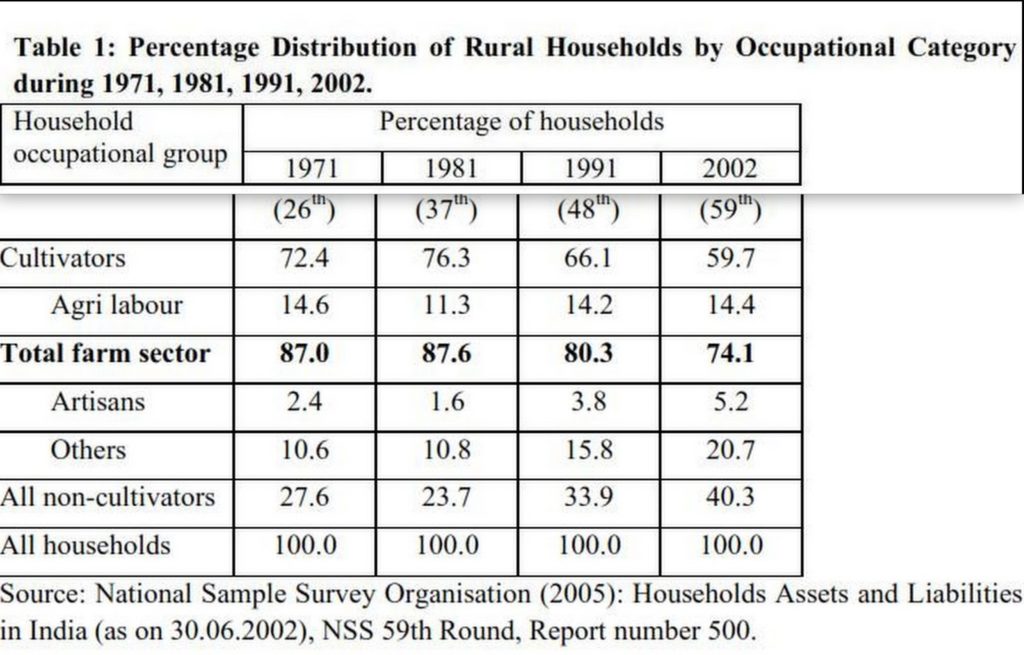
The N.S.S report 500 on ‘Households Assets and Liabilities in India’ for the period 2002 gives some indicators of the changing rural structure. The survey was conducted for rural as well as for urban areas but this paper concentrates only on the rural sector. In all these rounds rural households are classified into two major groups. One, the cultivators who are identified as households operating at least 0.002 hectares of land and the second, the non-cultivators who operate no land or operate land less than 0.002 hectares. The non- cultivators are further classified into ‘agricultural labourer’, ‘artisans’ and ‘other’ households.
In the above classification the cultivators have a relation with the agricultural labour households as well as with the artisan and in turn the artisans have a relation with non-cultivators and also the cultivators. This relation facilitates current production or future production. But the ‘other’ is a non-descriptive category, which could include different types of agents. They can be the traditional landlords, input and output traders, moneylenders, commission agents and urban workers staying in villages.
The table 1 and 2 provide summarized information of the data. The table 1 gives the changing rural structure between 1971 and 2002. There are two interesting observations. During the period 1971- 81 there is an increase in households reporting cultivation. A declining proportion of agricultural labour households accompanies this. For the rest of the groups, there are marginal changes. In other words, farm-non-farm composition remained more or less the same between 1971 and 1981. However, there are drastic changes between 1981 and 2002. There is a sharp decline in the households depending on the farm sector. This decline is mostly due to the decline in the cultivating households. The cultivating households declined from 76.3 % to 59.7%, while agricultural labour households remained more or less the same. In the non-farm activities the increase is sharp from 10.8 percent to 20.7 percent.
The NSS report (No 500) gives the value of assets and their distribution for cultivators and non-cultivators. The cultivating households pre-dominate in the asset distribution. On average, they hold Rs 3.72 lakhs worth of assets. The non-cultivating households on the average hold Rs 1.07 lakhs worth of assets (table 2). The pre-dominance of agricultural labour households in the non-cultivating households, whose asset position is likely to be very poor, must have pulled down the average for the non-cultivating households. However, the non-cultivators show a 38.2 percent of their assets in the form of land (table 2).
In the asset wise Composition, non-cultivating households show a difference from cultivators with a substantial share in financial assets, household durables and building, while the cultivators show a pre-dominance of land in their asset base. Widely different portfolio of the non-cultivating households possibly indicates their nearness to the rest of the world compared to cultivating households. Thus the non-cultivating households show certain linkages with the growth and also indicate the diversification of the rural sector into non-farm activities. Their interest in land seems to be important. To the extent these households own land and do not self cultivate it, they continue to exert influence on the land market, lease market and thus the production structure of agriculture. These households we christened as non-cultivating ‘peasant’ households (NCPH).
These households are non-cultivators as they themselves do not cultivate the land but are peasants to the extent that they are moving away from cultivating practices to non-farm activities without completely breaking from the peasant origin by holding the land. The increase in non-cultivating households implies a simultaneous decrease in the cultivating households. Since the NCPH holds land but does not cultivate, for purpose of operation the group has to depend on land tenancy market. The lessee can be either cultivator who owns land and leases in to enhance production or by an agricultural labour household who makes a transition to becoming cultivator for reasons of reducing uncertainty in the income.
Thus the existence of NCPH can lead to an increase either in the pure or the mixed form of tenancy. The mixed tenancy case depends on expanding output market while the pure tenancy case depends on the agricultural labour households and the nature of labour market. Some estimates, based on the NSS 59th Round on Households Assets and Liabilities in India, of the importance of NCPH on land can be obtained from the report. 6.5 percent of the rural households do not own any land, while 39.28 percent of the households are cultivators who own land and 34.29 percent of the NCPH own land. In terms of value of land, cultivators own 90 percent of the total value, while NCPH own the rest. In other words non-cultivating ‘peasant’ households own 10 percent of the value of land. Further, the all India figures indicate pure tenants constituted 0.7 percent of the cultivating households. Naturally, these households are agricultural labour households. The persistence of the NCPH and pure tenancy is an important structural change one notices in the rural economy. The importance of non-cultivating ‘peasant’ households varies across states and this data is presented subsequently.
|
Cultivators
|
Non-
cultivators
|
All rural
households
|
|
|
Average value of asset
|
Rs 3,72,632
|
Rs 1,07,230
|
Rs 2,65,606
|
|
Share of asset in total asset
|
83.71
|
16.28
|
100
|
|
Composition of assets
|
|||
|
Land
|
68.1
|
38.2
|
63.2
|
|
Building
|
20.1
|
41.4
|
23.5
|
|
Livestock and poultry
|
2.3
|
1.3
|
2.1
|
|
Machinery and equipment
|
3.8
|
3.4
|
3.7
|
|
Household durables
|
4.2
|
10.0
|
5.1
|
|
Financial assets
|
1.6
|
5.4
|
2.2
|
|
Dues recoverable
|
0.1
|
0.2
|
0.1
|
|
Total
|
100
|
100
|
100
|
(Source: National Sample Survey Organisation (2005): Households Assets and Liabilities in India (as on 30.06.2002), NSS 59th Round, Report number 500.)
